Awatchfire

Jones County, South Dakota

Van Meter Fire

Burning 14.0 miles north-west of Murdo and 15.6 miles north of Okaton, since Tuesday 8 September.

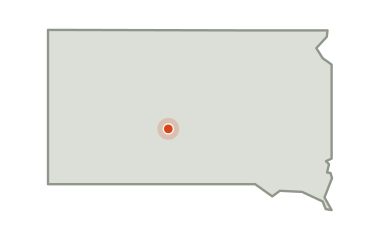
Map of South Dakota. The Van Meter Fire burns .
Where the fire is in the state.

1,091

acres burned so far — about 2 square miles

36

days burning so far

—

no share of the perimeter reported held yet

The picture as of 10:09am today

The Van Meter Fire is still listed as active, and has not been looked at lately. Nothing has given off fresh heat for 883 hours.

No fresh look at this fire for 883 hours. Everything on the map below was seen before then.

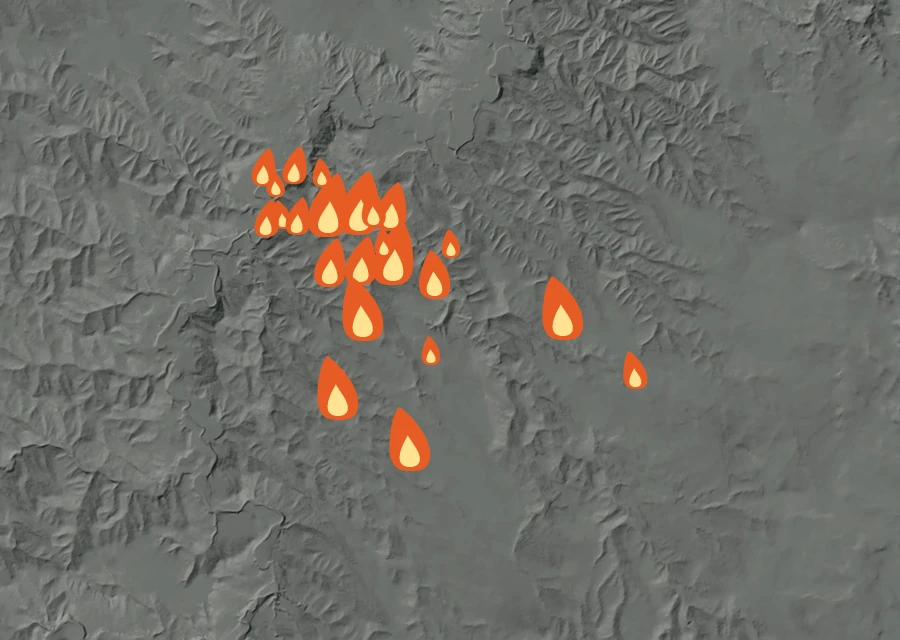
Shaded relief map of the Van Meter Fire. Amber flames mark every place that gave off heat in the last day; the shading is the shape of the ground.
Heat in the last day Higher ground pale, valleys dark

883hours

since anything was last seen giving off heat — about 3:05pm on Tuesday, local time.

103% more

energy in the last 0.7 hours of the record than in the 0.7 before them — the fire was hotter when it was last seen.

12.2miles

is how close the heat has come to Murdo at any point in the record. In the last day the nearest heat has been None miles from it, and the closest this fire has come to Okaton is 14.2 miles, None in the last day.

2.6miles

is the furthest any heat has been seen from the point on the official record — the width of the ground involved so far.

Smoke has been recorded lying over this ground 11 times so far. The thickest of it was moderate between 9:00am and 11:00am local time. The last of those windows closed 113 hours ago, so what is overhead now is not known.

Where the heat is

No cluster large enough to call a separate front. The heat is in one piece.

Nothing close enough to the fire has reported the conditions on the ground.

How it got here

One day of record on a day-38 fire

The record here begins at 1:38pm on 8 Sep and runs to 3:06pm on 8 Sep — 2 hours, 23 readings of heat. The fire is on day 38, so the first 37 days are missing: nothing showed up from above until the fire was large enough and the sky over it clear enough for it to be seen. There is no long arc to draw yet. What follows is what has actually happened.
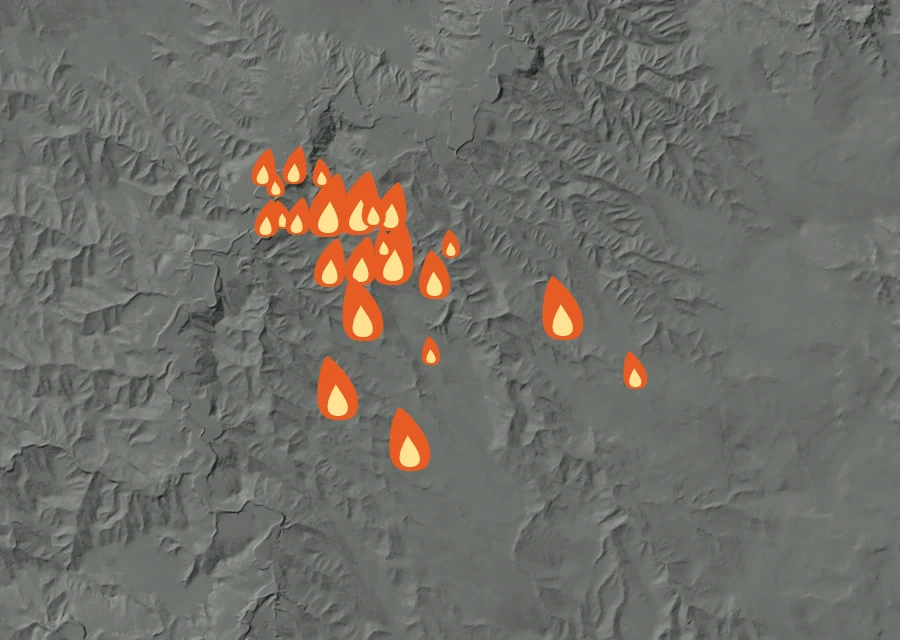
Animated map of the Van Meter Fire across the whole record, with a time bar along the bottom showing energy released and the local date.
The whole record, 9 frames at 1 hour a frame. The bar along the bottom is energy released; the moving line is the clock.

Hour by hour local time

Tue 1:00pmTue 3:00pm

Each bar is one hour of local time, sized by how much energy the fire gave off in it. This fire is too young for a day-against-day comparison to say anything, so the hours are shown instead.

Day by day 1 day of record

How the record has moved

Each step is a change on the interagency incident record — acreage, containment or crews — with the date it was reported. No satellite reading is involved.

  1. Tuesday 8 September

    First reported at 300 acres

    300 ac
  2. Tuesday 8 September

    300 acres on record

    300 ac
  3. Tuesday 8 September

    Grew to 1,091 acres

    1,091 ac

No containment figure has been reported for it yet. No crew count has been published for it yet. It has grown from 300 acres when it was first written down to 1,091 now. Nothing has looked at it for 883 hours, and the record still lists it as active.